Angle Fantasy Basketball
Projected per-game averages for 2026-27, built from real 2025-26 and 2024-25 stats. The projections are then adjusted for age, development year, contract year, injury returns and new roles. The rank is each player's category value weighted by projected games. Switch to Totals for season totals, Z-scores to see value per category, or punt categories to re-sort for a build. Once the season starts, switch to Blend or Real to rank on how players are actually producing.
| Trend | What the history says |
|---|---|
| Age curve | Box-score production peaks around 27–28. The average player's BPM change is about zero at 24 and about −0.36 per year by 29. Athletic stats fade first. |
| Years 2–4 leap | Most Improved Player winners average year 4 in the league, and leaps cluster at ages 24–25. Second-to-third-year jumps are a documented pattern (FiveThirtyEight's "junior jump"). |
| Veteran decline | Players 36 and older who aren't stars lose production faster than the general age curve shows. Stars who still score 22+ points a game, like Stephen Curry and Kevin Durant, tend to hold their level longer. |
| Contract year | The effect is small. One study found a 2.83% PER gain, but only after excluding superstars. Another found a 3–5 percentile boost for the median player, and some studies find no effect. So the bump is modest and skips stars. |
| Injury return | First seasons back from these injuries usually come with lower efficiency and managed minutes. |
| Games played | Projections start from each player's recent games played, then I adjust for known injuries and age. A player who misses a third of the season leaves your roster spot empty for weeks, and a per-game rank hides that cost. |
Rankings for points leagues using each site's default scoring. They use the same player projections as the 9-cat board, scored with fantasy points instead of categories. Ranked by projected season fantasy points, which are points per game times projected games. Pick Custom to enter your own league's scoring. Switch to 100% healthy to rank on points per game. Once the season starts, Blend and Real rank on actual production.
Live box scores and fantasy points from today's games. Tap a game for its full box score, split by team. Updates every minute while games are on. Use the calendar to look back at past nights or ahead to upcoming games. Days and tip-off times follow your own time zone.
Every team's 2026-27 schedule by fantasy week. Find the teams with the most games in your fantasy playoffs, the most low-volume games for streaming, and the fewest back-to-backs.
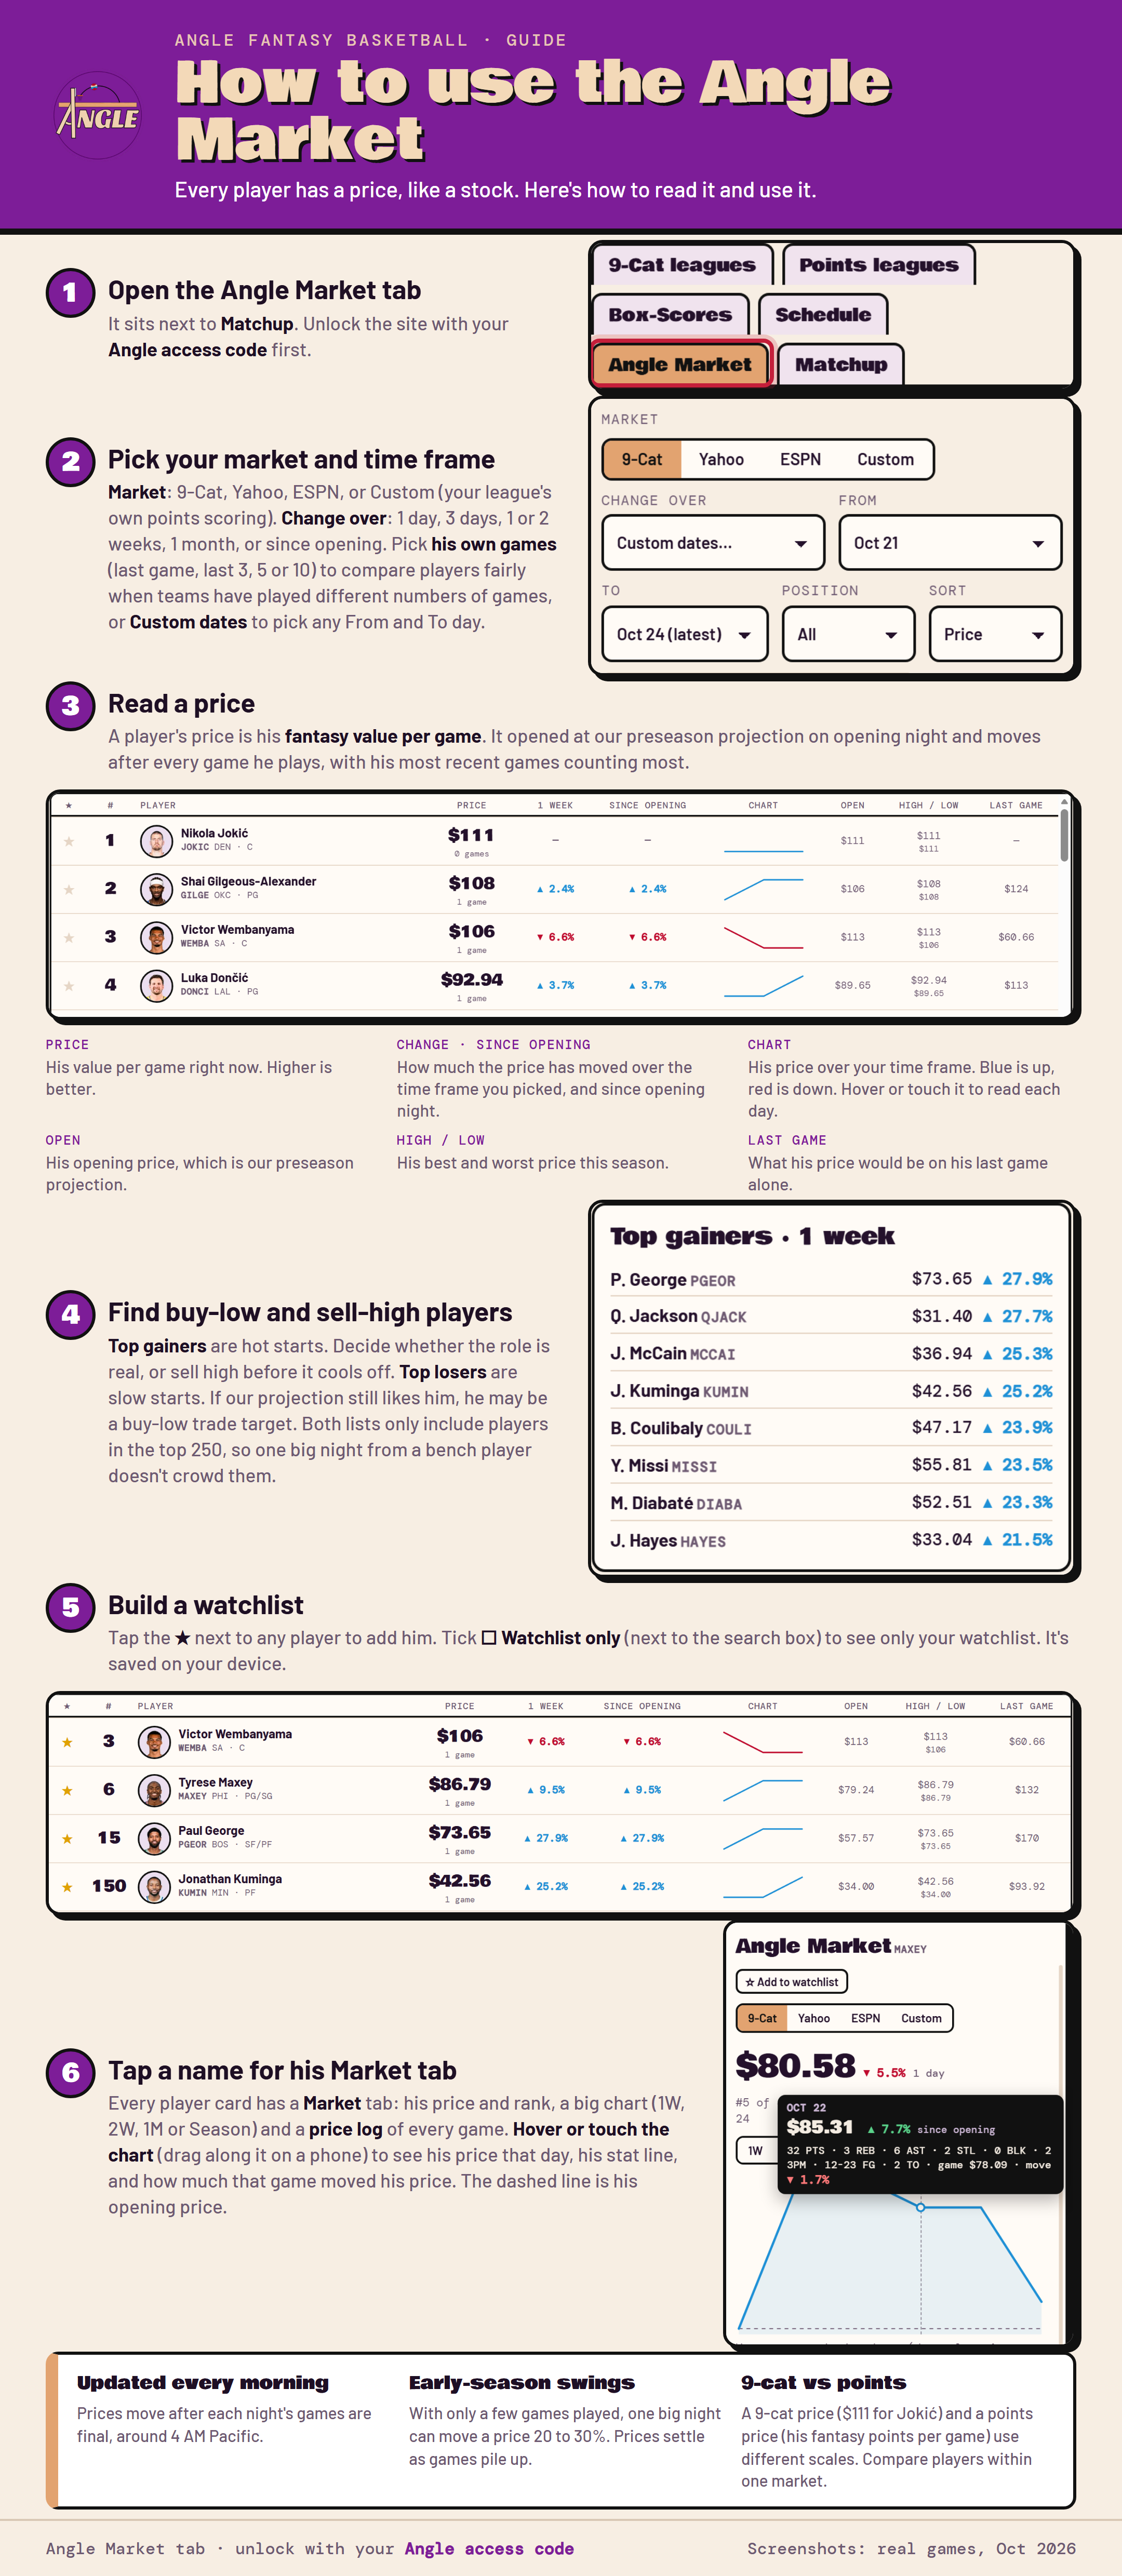
The Angle Market trades every player like a stock. A player's price is his fantasy value per game. It opened at our preseason projection on opening night and moves after every game he plays, with his most recent games counting most. Buy low on the losers, sell high on the gainers, and keep a watchlist of the players you're tracking.
Project a head-to-head week. Add your roster and your opponent's, and see each side's projected category totals and score, from each player's games that week. Switch the stats between our Projections, the Blend of projections and real games, or Real season-to-date production. Players ruled out only count the games after their expected return.